Measuring Cache Hierarchy on Apple M4 with Pointer Chasing
While exploring parallel computing concepts on my own time, I decided to set up an experiment to measure cache latencies on my M4 MacBook. The results revealed some interesting characteristics of Apple Silicon—particularly the 128-byte cache lines and the dramatic latency differences across the memory hierarchy.
This post walks through the pointer chasing technique I used, the M4-specific findings, and what the numbers mean for writing cache-friendly code.
Key Takeaways
What you'll learn:
- What is the cache hierarchy and what benefits does it confer?
- How to measure cache sizes using pointer chasing—a technique that defeats CPU prefetching
- M4's actual latency numbers: L1 (~0.7ns) → L2 (~1.5ns) → Main memory (~6.4ns)
- Why M4's 128-byte cache lines matter—double Intel's 64-byte lines, affects struct padding and false sharing
- Practical working set guidelines: Keep hot data under 128KB (L1) or 16MB (L2) when possible
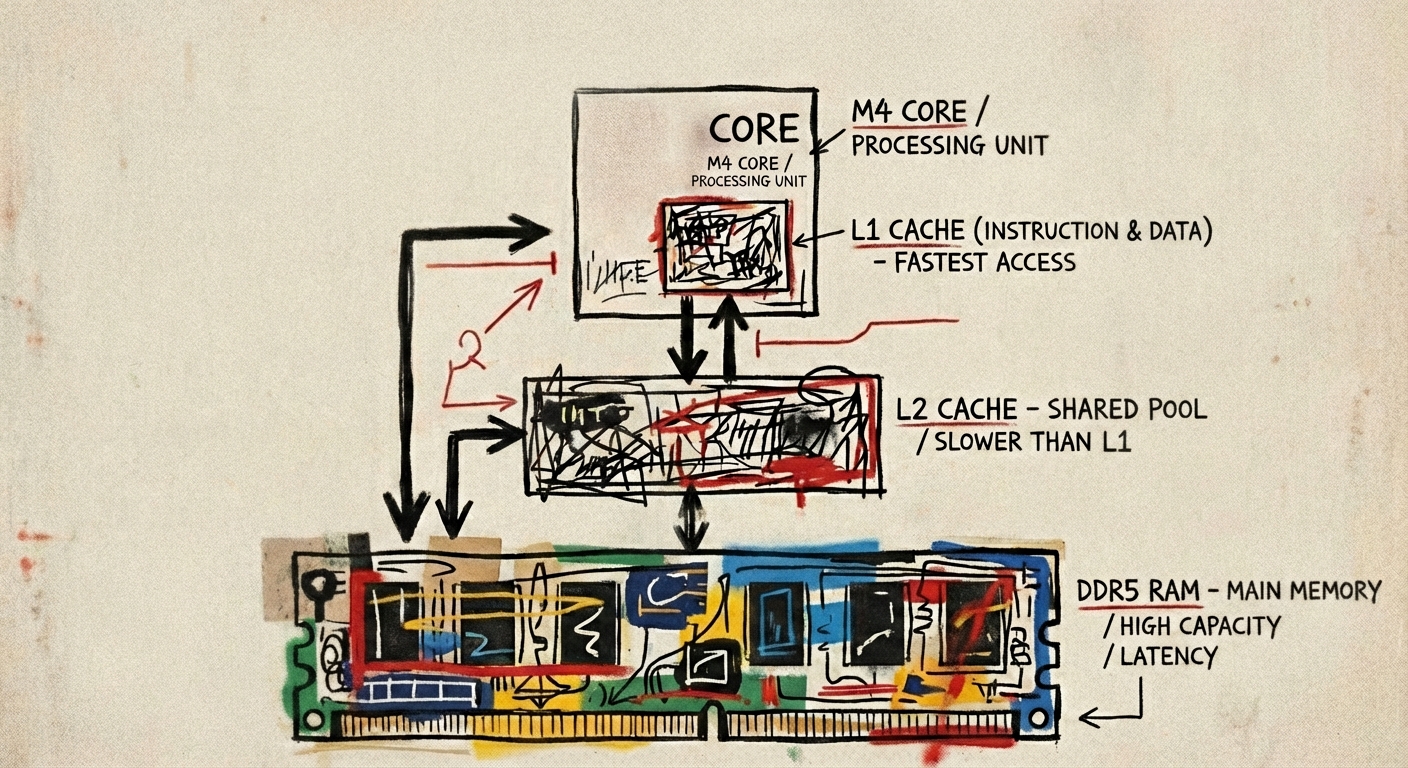
M4 Cache Hierarchy: Performance cores feature 128 KB L1 and access to a shared 16 MB L2, with latencies ranging from ~0.7 ns (L1) to ~6.4 ns (main memory).
The Memory Hierarchy in Practice
Why do these numbers matter?
A 9x latency difference means cache-friendly code can be dramatically faster. Working set size determines which cache level you're hitting. M4's architecture differs from Intel in ways that affect optimization.
Practical implications:
- Hot data structures under 128 KB benefit from L1 speeds
- Working sets under 16 MB stay in L2 territory
- Random access across large arrays incurs the full main memory penalty
- Data layout (struct-of-arrays vs array-of-structs) affects cache utilization
Why Naive Benchmarks Don't Work
The problem with measuring memory latency directly:
- Modern CPUs use hardware prefetching to anticipate access patterns
- Sequential or strided access triggers prefetching, masking true latency
- Need a technique where each access depends on the previous result
This is where pointer chasing comes in—it creates a data dependency that the prefetcher cannot anticipate.
How Pointer Chasing Works
Each memory access depends on the value returned by the previous access. The CPU cannot prefetch because the next address is unknown until the current load completes.
Think of it like a scavenger hunt where each clue reveals the location of the next clue—you can't skip ahead.
Setting up the pointer chain:
1 | // Create a circular linked list with cache-line-sized jumps |
The traversal loop:
1 | // Chase pointers 1 billion times |
The volatile keyword prevents the compiler from optimizing away the repeated loads. Without it, the compiler may hoist the load out of the loop or eliminate it entirely, invalidating the benchmark.
Apple Silicon Differences
Key platform constants for M4:
1 |
M4 Cache Hierarchy:
| Level | Performance Cores | Efficiency Cores |
|---|---|---|
| L1 | 128 KB | 64 KB |
| L2 | 16 MB (shared) | 4 MB (shared) |
| L3 | None | None |
| Memory | Unified | Unified |
Key differences from Intel/AMD:
- 128-byte cache lines (double the typical 64 bytes)
- No L3 cache—relies on large L2 and unified memory architecture
- 16 KB page size vs 4 KB on most Linux systems
Practical implications:
- Struct padding for cache alignment needs 128-byte boundaries on M4
- False sharing thresholds differ—threads writing to addresses within 128 bytes may contend
- Memory alignment functions like
aligned_allocshould use 128-byte alignment
Checking Your Cache Configuration
Before running any benchmarks, you can query your system's cache parameters directly. On macOS, the sysctl command exposes this information:
1 | # Cache line size |
Note that sysctl reports per-core values and may show efficiency core specs depending on which core handles the query. On my M4, it reports the efficiency core's 64 KB L1 and 4 MB L2, while the performance cores have 128 KB L1 and access the shared 16 MB L2.
For a complete view of all cache-related parameters:
1 | sysctl -a | grep cache |
These values give us targets to validate with our experiments—if the pointer chasing technique works correctly, we should see latency transitions at these boundaries.
Experiment 1: Measuring Cache Sizes
Methodology:
- Buffer sizes from 4 KB to 32 MB (powers of 2)
- Stride of 128 bytes (one cache line per access)
- 1 billion pointer traversals per buffer size
- Measure total time, compute per-access latency
Results:
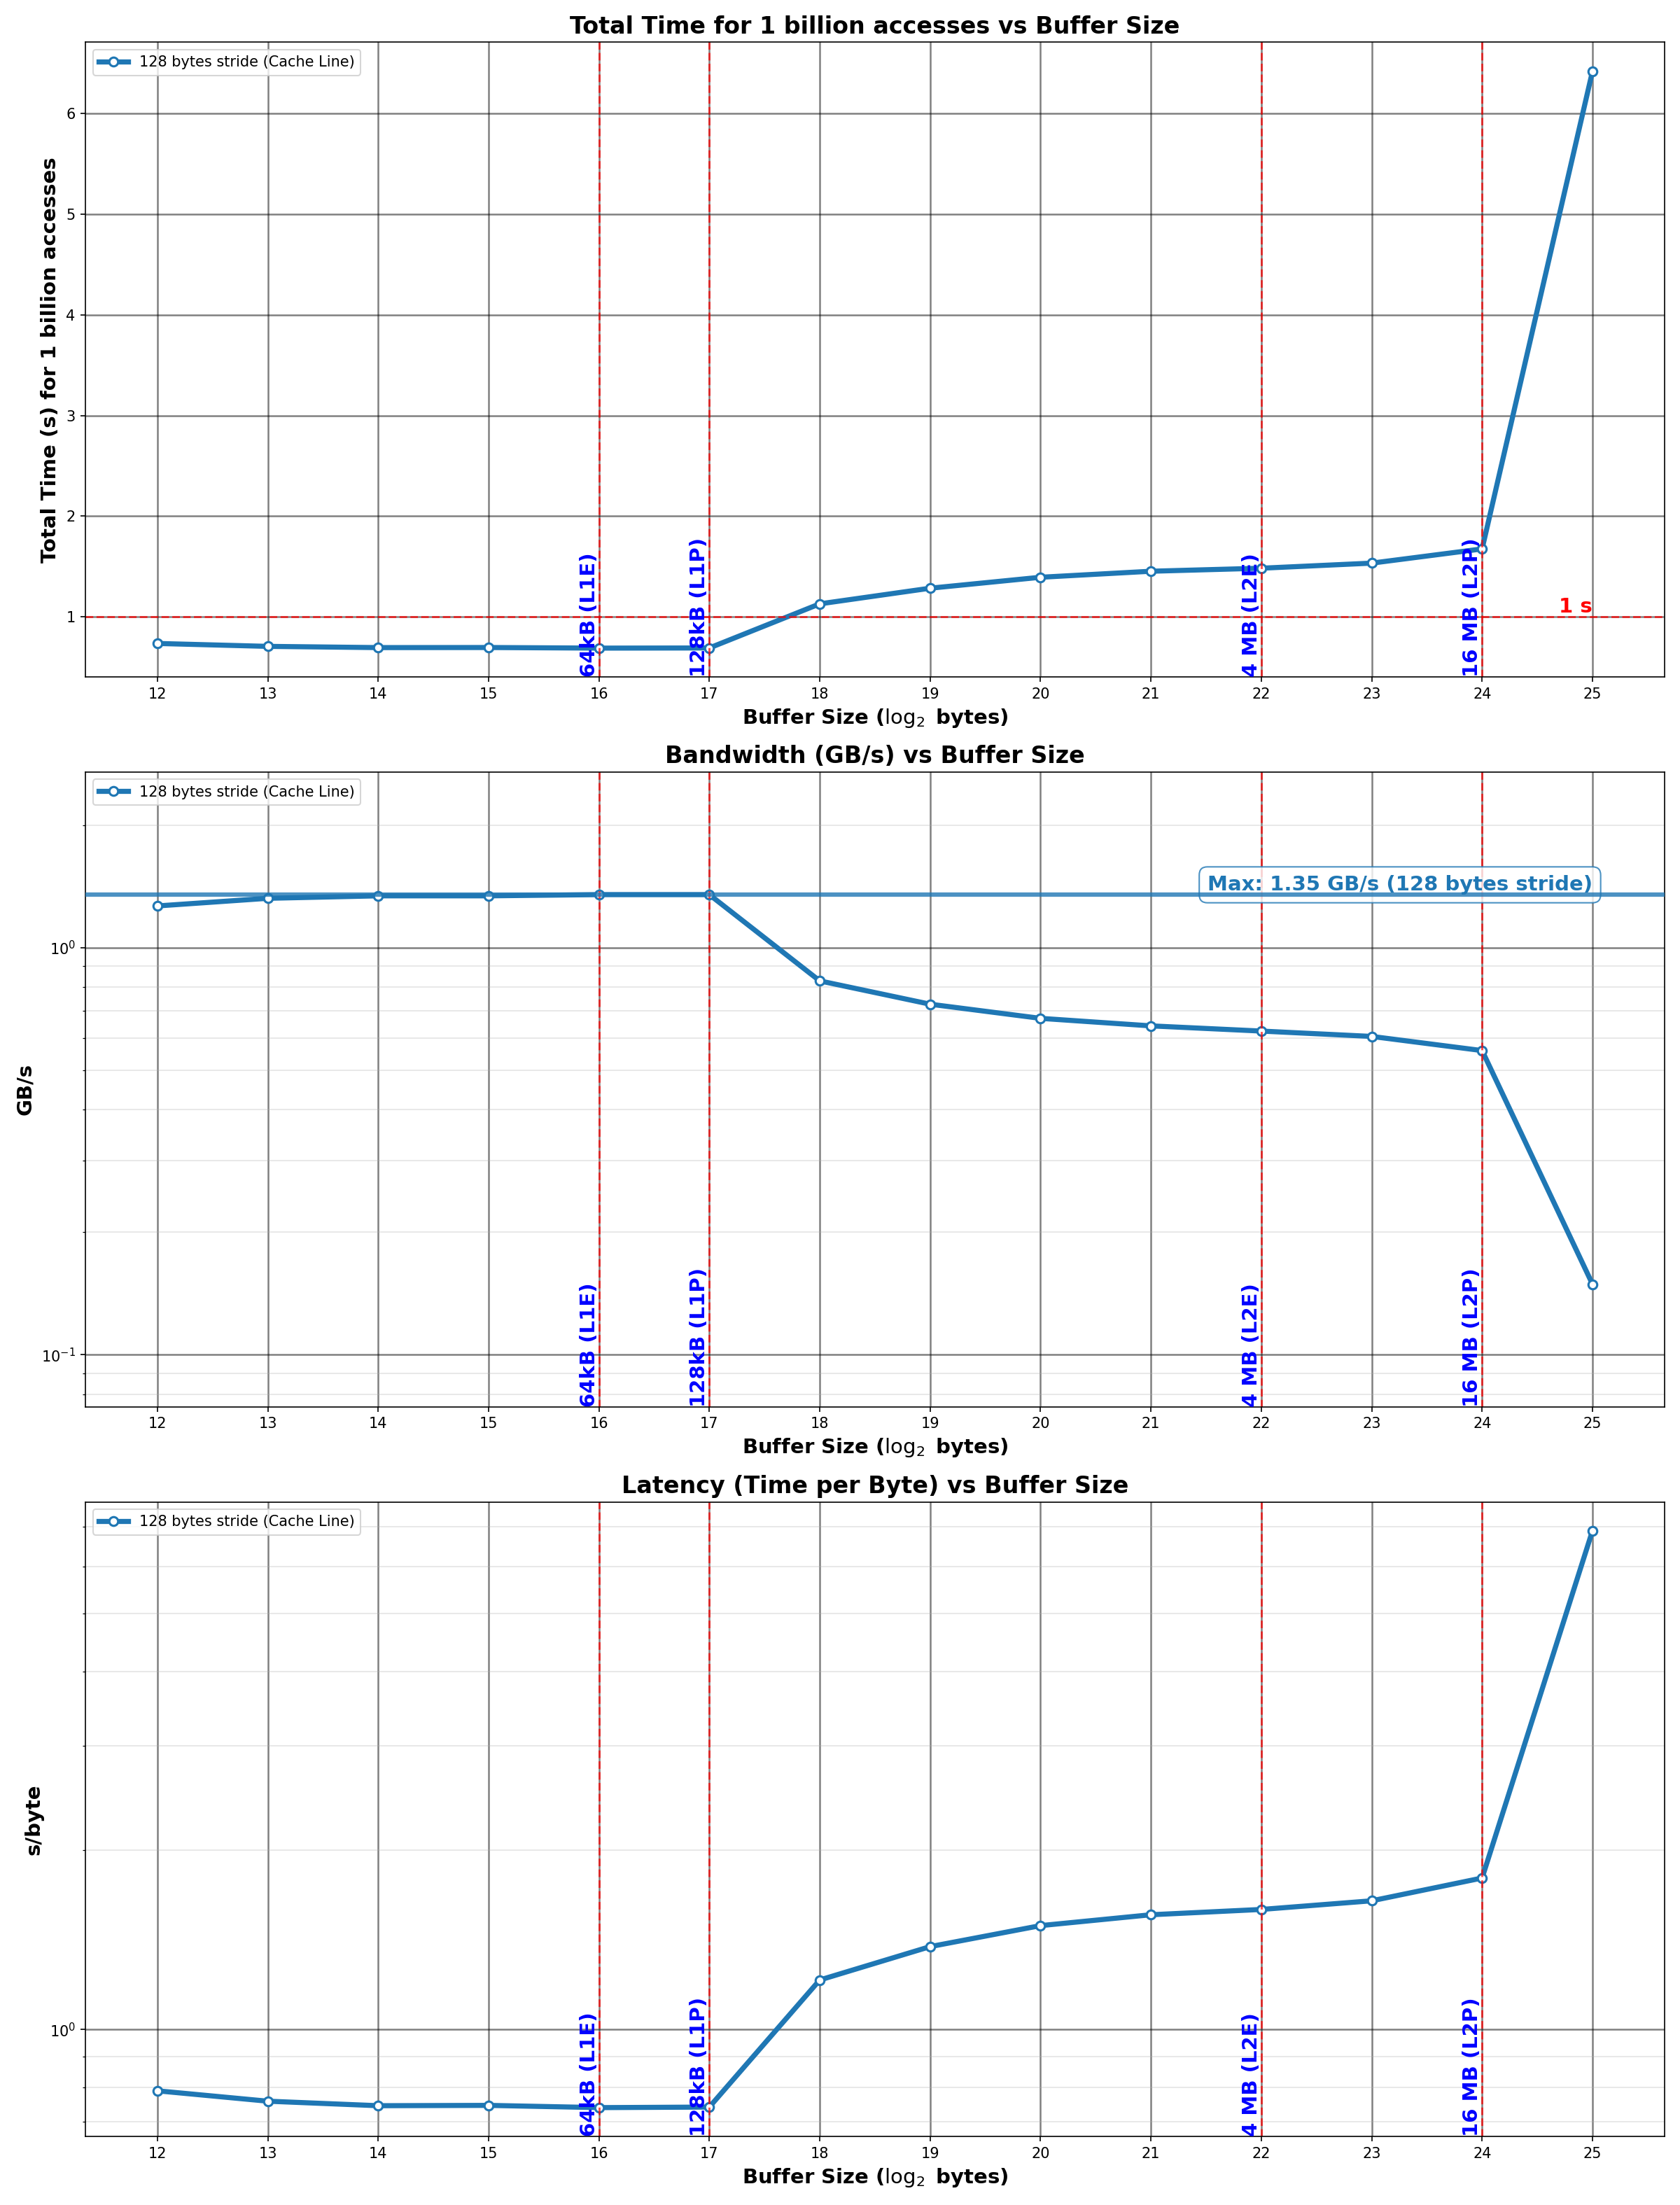
Figure 1: Access latency vs. buffer size. Clear plateaus reveal cache boundaries at 128 KB (L1) and 16 MB (L2).
Analysis:
The plot shows three distinct regions:
- Flat region (up to ~128 KB): L1 cache—consistent low latency around 0.7 ns
- Gradual increase (128 KB to 16 MB): L2 cache—latency rises to ~1.7 ns
- Sharp jump (beyond 16 MB): Main memory—latency spikes to ~6.4 ns
The boundaries align with M4's documented cache sizes: 128 KB L1 (performance cores) and 16 MB L2.
Takeaway: Working set size directly determines which latency tier your code operates in. The difference between fitting in L2 vs spilling to main memory is a 4-9x latency penalty.
Experiment 2: Measuring Cache Line Size
Methodology:
- Multiple buffer sizes (4 KB to 32 MB)
- Vary stride from 8 bytes to 256 bytes
- Look for latency transition points
Results:
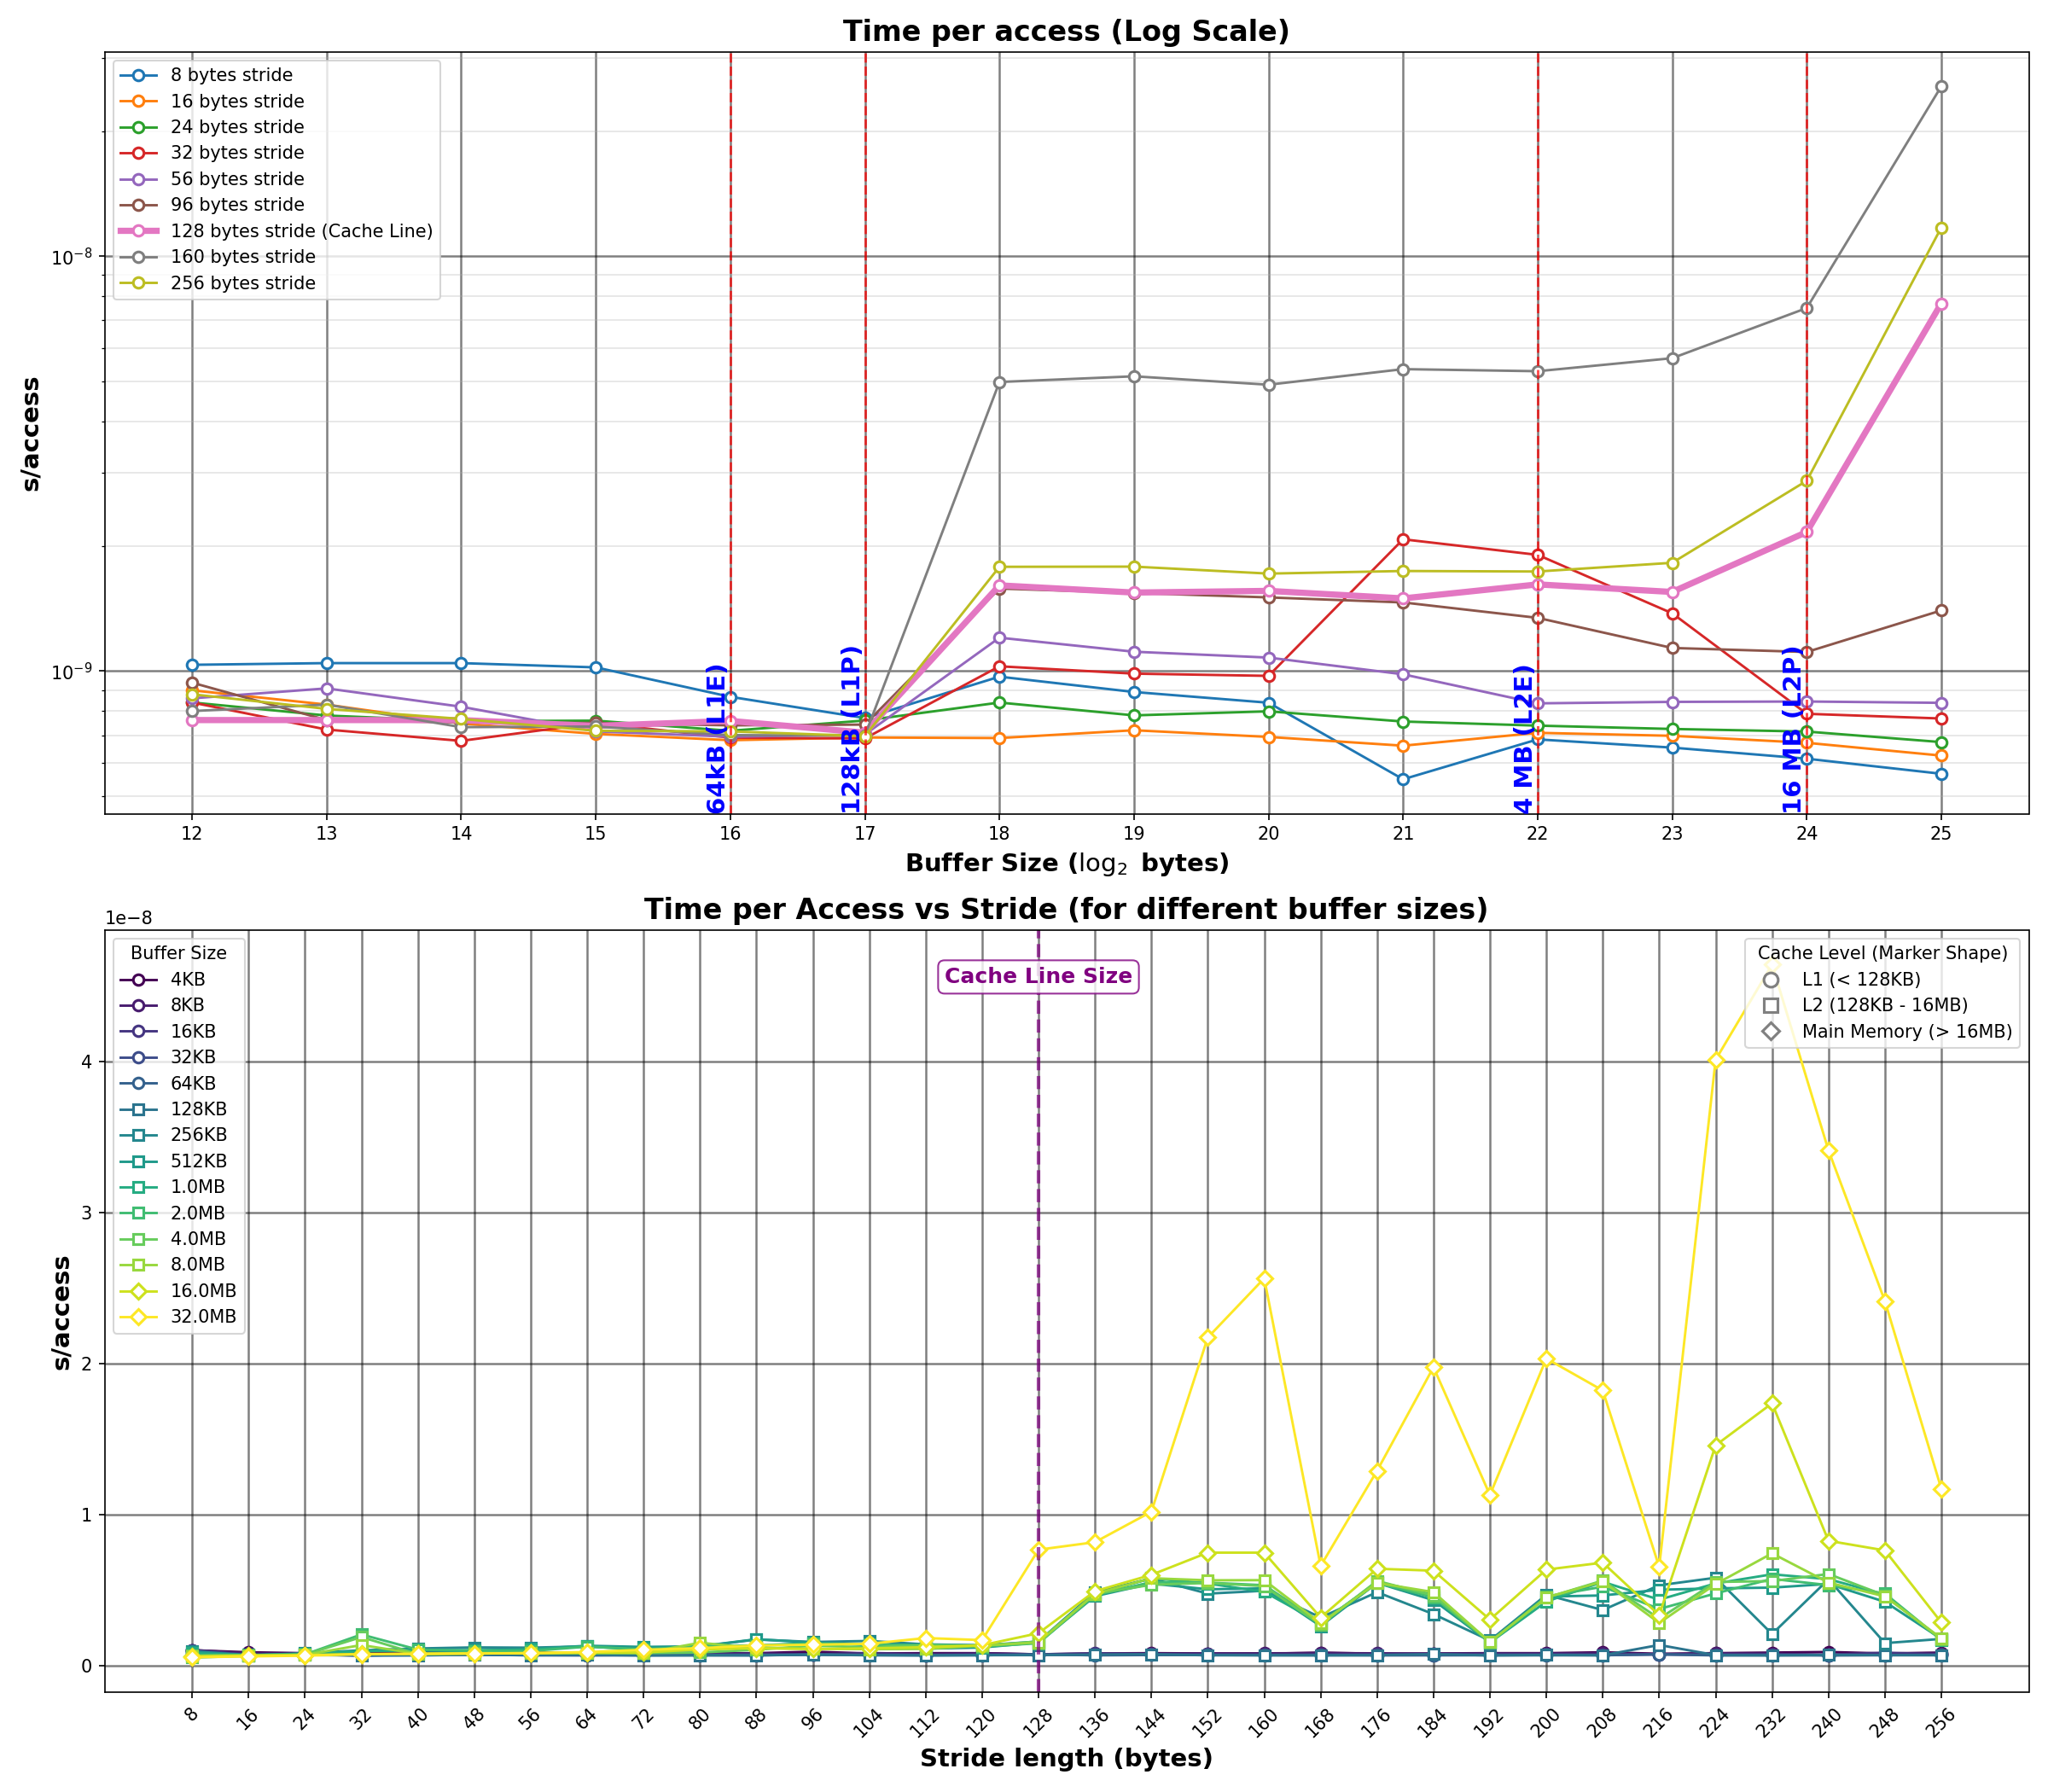
Figure 2: Latency vs. stride for various buffer sizes. The transition at 128 bytes confirms M4's cache line size.
Analysis:
The stride vs. latency plot reveals a consistent pattern across buffer sizes:
- Strides ≤128 bytes: Similar latency (accessing within single cache line or adjacent lines)
- Strides >128 bytes: Latency increases (each access touches a new cache line)
The transition at 128 bytes confirms M4's cache line size. For larger buffer sizes (those that exceed L1), the effect is more pronounced because cache misses occur more frequently.
Practical Guidelines
Working set sizing:
- Under 128 KB: L1 speeds (~0.7 ns/access)
- Under 16 MB: L2 speeds (~1.5 ns/access)
- Over 16 MB: Main memory (~6.4 ns/access)
Data layout considerations:
1 | // Large struct spans multiple cache lines |
False sharing on M4:
1 | // On Intel (64-byte lines), 64-byte alignment suffices |
Access patterns:
- Sequential/strided access benefits from prefetching
- Random access across large arrays incurs full latency penalties
Example: Cache-Aware vs Cache-Oblivious Code
To illustrate the practical impact of cache hierarchy, consider matrix transpose—a common operation with inherently poor cache locality. The naive implementation accesses memory in a pattern that conflicts with how caches work.
Cache-Oblivious (Naive) Approach:
1 | // Reads rows, writes columns—terrible cache behavior |
Problem: The inner loop writes to dst with stride n, jumping across cache lines. For a 1024×1024 matrix of doubles (8 bytes each), each write is 8192 bytes apart—far exceeding M4's 128-byte cache line. This thrashes the cache.
Cache-Aware (Blocked) Approach:
1 | // Tiled/blocked transpose—exploits cache hierarchy |
Why blocking helps:
- Processes small tiles (e.g., 64×64) that fit in L1 cache
- Each block is fully transposed before moving to the next
- Reduces cache misses by maximizing reuse of loaded cache lines
- On M4 with 128 KB L1, a 64×64 double matrix (32 KB) fits comfortably
Choosing block size for M4:
1 | // Rule of thumb: block size should fit comfortably in L1 |
Performance comparison:
1 | TODO: Add profiling results comparing naive vs blocked transpose |
Implementation Notes
A few issues encountered during implementation:
- No
pthread_barrier_ton macOS: Had to implement barrier synchronization manually for multi-threaded bandwidth tests - Compiler optimization: The
volatilekeyword is essential; without it,-O3will eliminate the pointer chase loop entirely - Timer resolution: 1 billion iterations ensures timing measurements exceed timer granularity and average out system noise
- Memory alignment: Used
aligned_alloc()with 128-byte alignment for consistent results
Conclusion
The memory hierarchy has a direct impact on performance. On M4:
- L1 to main memory represents a ~9x latency difference
- 128-byte cache lines differ from Intel's 64-byte lines
- Working set size determines which cache level dominates your access patterns
The pointer chasing technique provides a way to measure these characteristics empirically, useful for validating assumptions and understanding unfamiliar hardware.